Value Judgements: Viewing the Premium’s Performance Through History’s Lens
Has value really lost its vigor? While growth stocks have outperformed in the past decade, value returns have largely tracked their long-term historical average.
There’s a misconception in the markets: value stocks have lost their vigor.
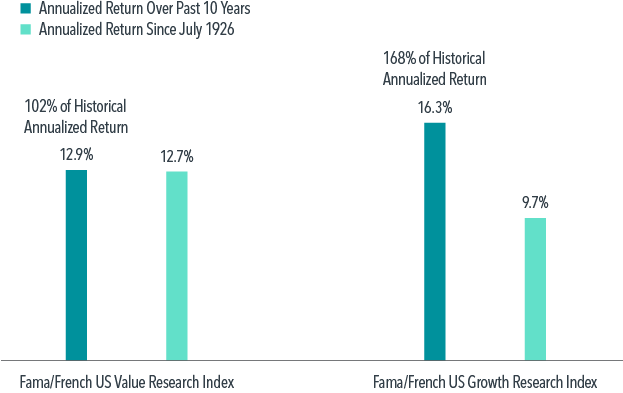
Value stocks have underperformed growth stocks over the past decade. In the US, the annualized compound return has been 12.9% for value stocks, or those trading at a low price relative to their book value. That contrasts with 16.3% annualized compound return for growth stocks, or those with a high relative price.1
Lessons of the Past
Value underperforming growth by 3.4 percentage points a year over a decade is indeed disappointing. But one question investors might ask themselves is, how do the returns for value and growth stocks over the past decade compare with their long-term averages?
Looking at returns for the US value and growth indices separately in Exhibit 1, we see that growth’s annualized compound return of 16.3% over the 10-year period ending June 2019 was much higher than its return since July 1926, at 9.7%. On the other hand, value performance over the past decade has been more or less in line with its historical average: 12.9% vs. 12.7%. We can see value has performed similarly to how it has historically behaved. It is growth stocks that have had very good recent returns relative to the long-term history. Investors maintaining an emphasis on growth stocks may be hoping this departure from the trend will endure, despite the historical long-term averages.
Exhibit 1: Outlier Detector
Performance of US value stocks in past 10 years and since 1926, and performance of US growth stocks over the same periods

As of June 30, 2019. In US dollars. Fama/French indices provided by Ken French. See Index Descriptions in the appendix for descriptions of Fama/French index data. Eugene Fama and Ken French are members of the Board of Directors of the general partner of, and provide consulting services to, Dimensional Fund Advisors LP. Indices are not available for direct investment. Their performance does not reflect the expenses associated with the management of an actual portfolio. Past performance is no guarantee of future results.
The World Over
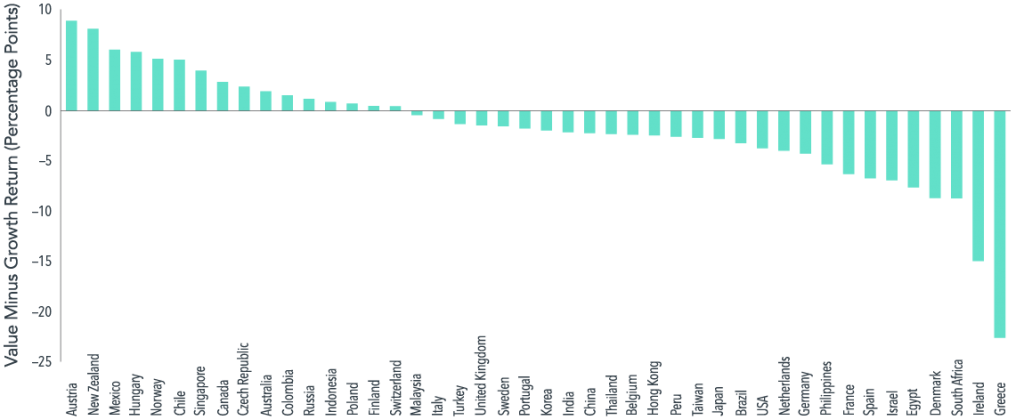
When someone refers to a negative value premium, you may want to ask, which market? The performance of value stocks in markets around the world over the past decade makes the case that the value premium is alive and well in some markets. As Exhibit 2 shows, value stocks have beaten growth stocks during the past decade in 16 of 44 developed and emerging markets, including Canada and Australia.
Exhibit 2: Ups and Downs
Advantage or disadvantage of investing in value stocks in select global markets over past 10 years, expressed as value stocks’ annualized return minus growth stocks’ annualized return

Value minus Growth is the difference between the annualized net returns (local currency) of the MSCI Standard (Large + Mid Cap) Value and Growth country-specific style indices over the 10-year period ending June 30, 2019, by country. MSCI data © MSCI 2019, all rights reserved. Indices are not available for direct investment. Their performance does not reflect the expenses associated with the management of an actual portfolio. Past performance is no guarantee of future results.
A Quick Comeback
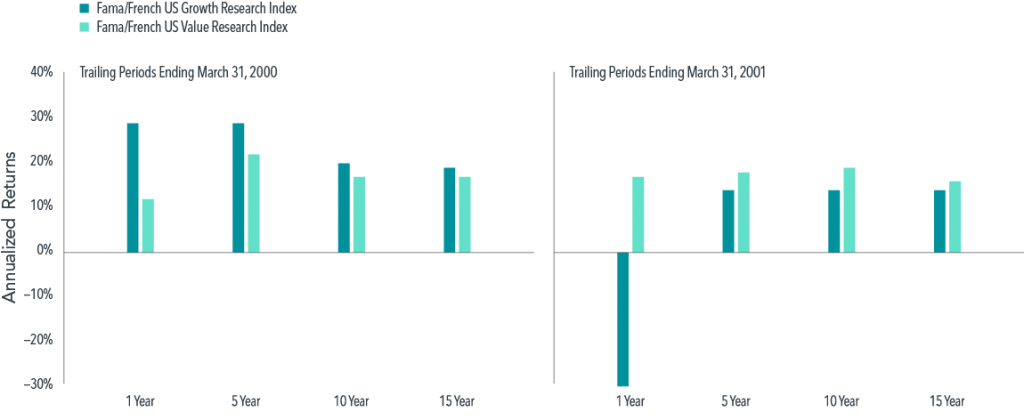
While stock returns are unpredictable, there is precedent for the value premium turning around quickly after periods of sustained underperformance. For example, some of the weakest periods for value stocks when compared to growth stocks have been followed by some of the strongest (see Exhibit 3). On March 31, 2000, growth stocks had outperformed value stocks in the US over the prior year, prior five years, prior 10 years, and prior 15 years. As of March 31, 2001—one year and one market swing later—value stocks had regained the advantage over every one of those periods.
Exhibit 3: Leap Year
Using March 31, 2000, and March 31, 2001, as ending points, performance of US value and US growth stocks over 1- to 15-year trailing periods

In US dollars. Fama/French indices provided by Ken French. See Index Descriptions in the appendix for descriptions of Fama/French index data. Eugene Fama and Ken French are members of the Board of Directors of the general partner of, and provide consulting services to, Dimensional Fund Advisors LP. Indices are not available for direct investment. Their performance does not reflect the expenses associated with the management of an actual portfolio. Past performance is no guarantee of future results.
Positioned for the Long Term
The theoretical support for value investing is longstanding—paying a lower price means a higher expected return. However, realized returns are volatile. A 10-year negative premium, while not expected, is not unusual.
But history also tells us that changing course after a disappointing spell for known premiums can lead to missed opportunities. When those drivers of outperformance have turned around in the past, steadfast investors have been rewarded. A key to successful long-term investing is sticking with your approach, even through difficult periods, so that you are there for the good times too.